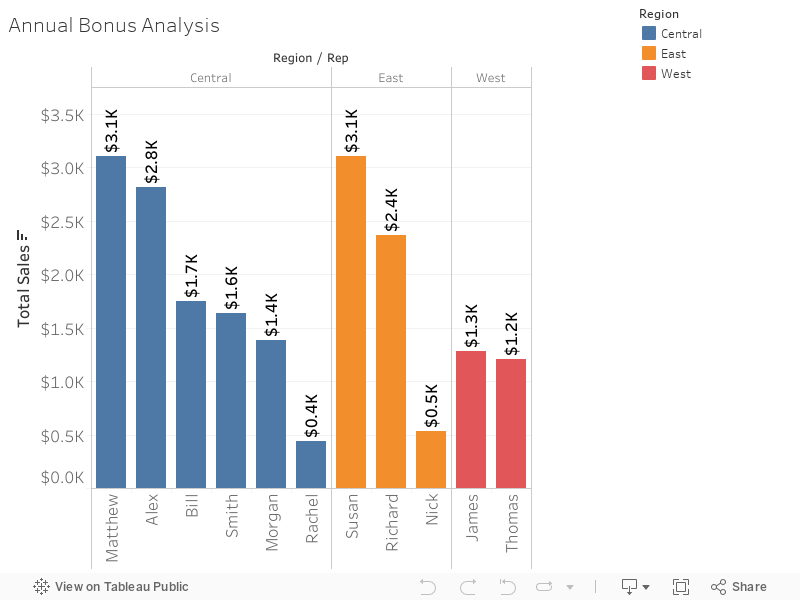
Used Tableau to create a visualization of sales structured to easily show Region, Representative, and total Sales to determine annual bonus. (example non-sensitive data)
Used in project:
- Connect to data source
- Calculated Fields
- Labels
- Formatting
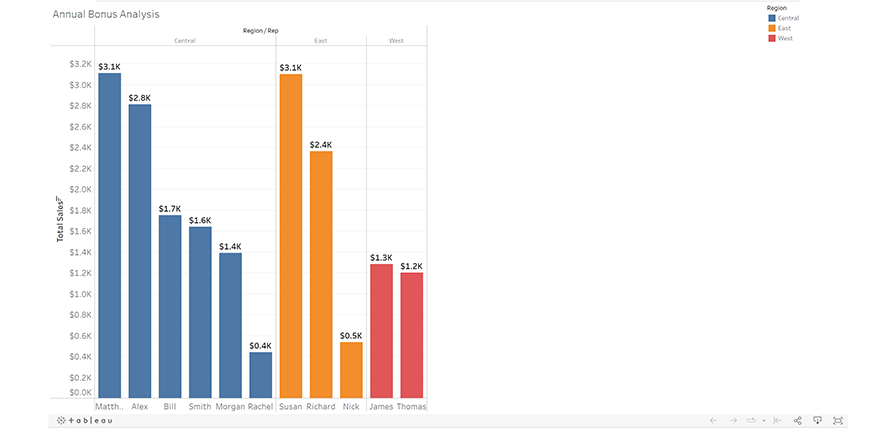
Used Tableau to create a visualization of sales structured to easily show Region, Representative, and total Sales to determine annual bonus. (example non-sensitive data)
Used in project: