Use Random Forest model, sklearn, python and the Kyphosis dataset to predict if the Kyphosis would return after surgery.
About:
This project / case study is for phase 1 of my 100 days of machine learning code challenge.
This is a homework solution to a section in Machine Learning Classification Bootcamp in Python.
Problem Statement:
Predict if Kyphosis will return to patient after corrective spinal surgery
Technology used:
Model(s):
Dataset(s):
Libraries:
Resources:
Contact:
If for any reason you would like to contact me please do so at the following:
Import Data and libraries
In [1]:
# Import Libraries
import pandas as pd
# import numpy as np
import seaborn as sns
import matplotlib.pyplot as plt
%matplotlib inline
In [2]:
# Import data
kyphosis_df = pd.read_csv('../datasets/kyphosis/kyphosis.csv')
In [3]:
kyphosis_df.head()
Out[3]:
In [4]:
kyphosis_df.tail()
Out[4]:
In [5]:
kyphosis_df.shape
Out[5]:
Explore Dataset
In [6]:
# Age in Months
kyphosis_df.describe()
Out[6]:
In [7]:
sns.countplot(kyphosis_df['Kyphosis'], label ='Count')
Out[7]:

In [8]:
from sklearn.preprocessing import LabelEncoder, OneHotEncoder
In [9]:
# change Kyphosis Column into number output
LabelEncoder_y = LabelEncoder()
kyphosis_df['Kyphosis'] = LabelEncoder_y.fit_transform(kyphosis_df['Kyphosis'])
In [10]:
kyphosis_df.head()
Out[10]:
In [11]:
kyphosis_true = kyphosis_df[kyphosis_df['Kyphosis']==1]
In [12]:
kyphosis_true.head()
Out[12]:
In [13]:
# 0 is usually equal to false
kyphosis_false = kyphosis_df[kyphosis_df['Kyphosis']==0]
In [14]:
kyphosis_false.head()
Out[14]:
In [15]:
print('Disease present after operation percentage is',
      (len(kyphosis_true)/len(kyphosis_df))*100, '%')
In [16]:
print('Disease not present after operation percentage is',
      (len(kyphosis_false)/len(kyphosis_df))*100, '%')
In [17]:
sns.heatmap(kyphosis_df.corr(), annot = True)
Out[17]:

In [18]:
sns.pairplot(kyphosis_df, hue='Kyphosis',
             vars = ['Age', 'Number', 'Start'])
Out[18]:

Data Prep
In [19]:
kyphosis_df.head()
Out[19]:
In [20]:
X = kyphosis_df.drop(['Kyphosis'], axis =1)
In [21]:
X.head()
Out[21]:
In [22]:
y = kyphosis_df['Kyphosis']
In [23]:
y.head()
Out[23]:
In [24]:
# Create train Test Split
from sklearn.model_selection import train_test_split
X_train, X_test, y_train, y_test = train_test_split(X,
                                                    y,
                                                    test_size=0.20,
                                                    random_state = 2,
                                                    stratify=y)
Train Model
In [25]:
# Decision tree
from sklearn.tree import DecisionTreeClassifier
decision_tree = DecisionTreeClassifier()
decision_tree.fit(X_train, y_train)
Out[25]:
In [26]:
# Find feature importance
feature_importance = pd.DataFrame(decision_tree.feature_importances_,
                                  index = X_train.columns,
                                  columns = ['importance'] )
In [27]:
feature_importance
Out[27]:
In [28]:
# Sorted Feature Importance
feature_importance = pd.DataFrame(
    decision_tree.feature_importances_,
    index = X_train.columns,
    columns = ['importance']).sort_values('importance',
    ascending = False)
In [29]:
feature_importance
Out[29]:
In [30]:
from sklearn.metrics import confusion_matrix, classification_report
In [31]:
y_predict = decision_tree.predict(X_test)
In [32]:
cm = confusion_matrix(y_test, y_predict)
In [33]:
sns.heatmap(cm, annot =True)
Out[33]:

In [34]:
print(classification_report(y_test, y_predict))
In [35]:
from sklearn.ensemble import RandomForestClassifier
In [56]:
randomforest_classifier = RandomForestClassifier(
                            n_estimators = 500,
                            criterion ='entropy')
In [62]:
randomforest_classifier.fit(X_train,y_train)
Out[62]:
In [63]:
y_predict_forest = randomforest_classifier.predict(X_test)
In [64]:
cm = confusion_matrix(y_test, y_predict_forest)
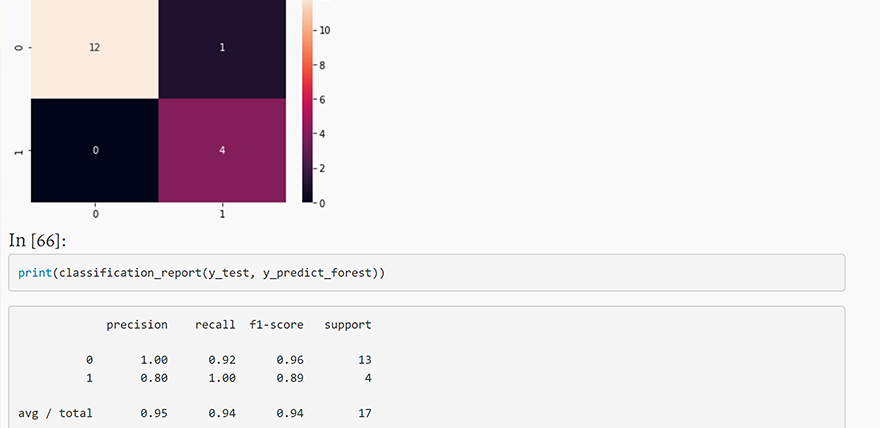
In [65]:
sns.heatmap(cm, annot = True)
Out[65]:

In [66]:
print(classification_report(y_test, y_predict_forest))