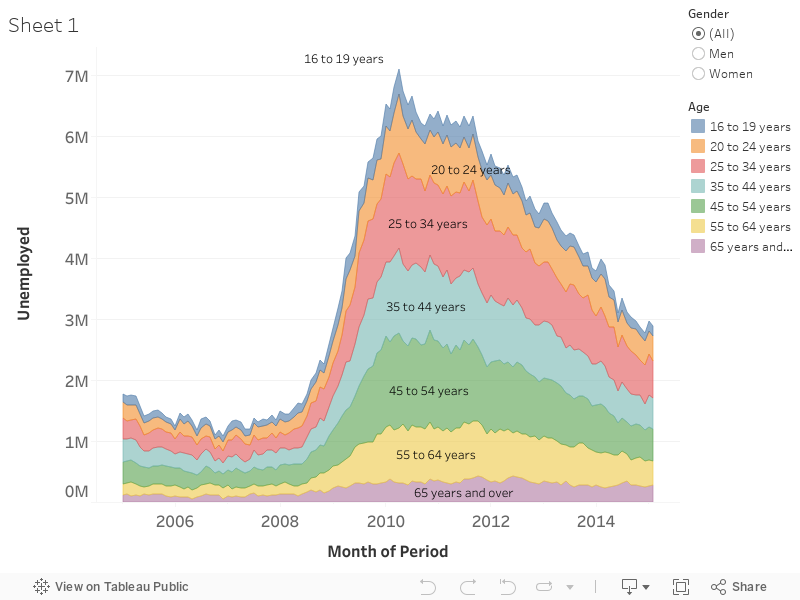
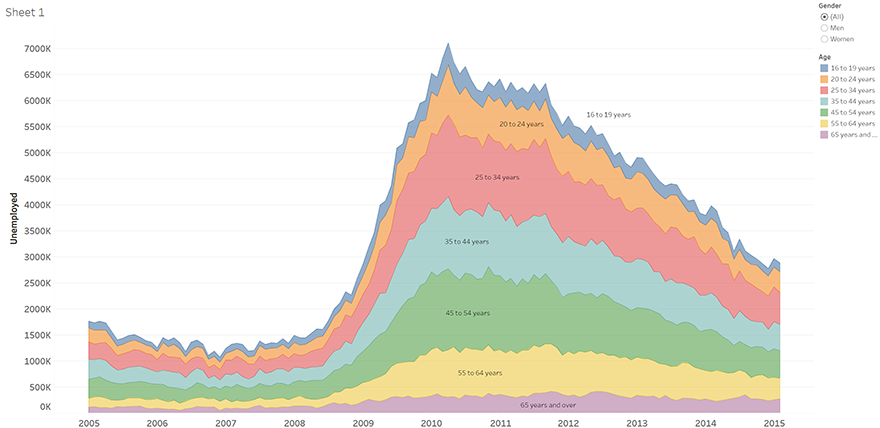
Used Tableau to create a visualization of USA unemployment rate structured to easily show Age, Gender, and Year. Quick filters included. (example non-sensitive data)
Used Tableau to create a visualization of USA unemployment rate structured to easily show Age, Gender, and Year. Quick filters included. (example non-sensitive data)